Originally posted on the Shapeways Tech blog
A few months ago, we released a new feature called “Dynamic Browse”, which enabled the dynamic creation and filtering of Marketplace pages on Shapeways.com. This enabled shoppers to more easily find products that would be of interest, as well as enabled our internal marketing and merchandising teams to create targeted shopper experiences on the fly. People started engaging with it: see for yourself.

However, there was a problem: it was kinda slow. We did see an improvement in user engagement. But that alone doesn’t mean that we were done. Here’s a great infographic from the KISSMetrics blog which illustrates this point: every second that your users spend waiting for a page to load is a second that they think about leaving. I won’t call out all the metrics listed in this chart (but you should really check ‘em out), but the conclusion here is that speed matters.
Our next steps were obvious: let’s make it faster! Great! Awesome! Excitement! ….how do we do that? The first step for us was to get some really granular measurements in place: we had a general idea of the performance of our pages, but not the specific data points required to understand the slowness. We use Datadog as a part of our monitoring and alerting system, not just because it’s easy to use (it is) and creates beautiful graphs and dashboards (it does), but because it’s very simple to set up your own custom metrics and track them to see what’s going on. So, to that end, we put together a very simple script that measured response time on one of our marketplace pages. We reported the total time from when the request is made until the first byte of the response is received (time-to-first-byte). When I say simple, I mean, REAL simple:
  #!/bin/python
  __author__ = 'matt'
  import requests
  from datadog import initialize, api
  options = {
      'api_key': OUR_API_KEY,
      'app_key': OUR_APP_KEY
  }
  initialize(**options)
  shapeways_marketplace_url = 'https://www.shapeways.com/marketplace/jewelry?li=home'
  r = requests.get(shapeways_marketplace_url)
  response_time_ms = r.elapsed.microseconds / 1000
  api.Metric.send(
      metric='perftesting.competition.response_time',
      points=(current_posix_time, response_time_ms),
      host=REPORTING_HOST,
      tags=['page:marketplace']
  )
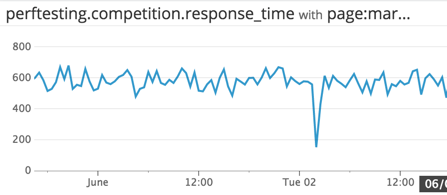
This script runs once a minute in a new session (no preserved cookies or cache), and simply tells us how long it took to receive the first byte. Initial results, to the surprise of no one, were not great:

It was taking around 600ms on average just to load the first byte! Things were slow on the server side.
We had an inkling that our search platform (which powers much of this feature) was not up to the task, and if that was the case the slowness on this portion of the request would be just the beginning: that same platform is used throughout the request to load different aspects of the page. We looked at the code and while there were definitely improvements to be made in the name of performance, we didn’t see anything that would create the kind of slowness we had measured. This left one other obvious place to check: infrastructure.
We use Solr to drive our search platform (which, as you have probably realized, is used for more than just searching for products). We have a single Solr master (which handles insertions and updates), and a pool of Solr slaves (which handle serving our web nodes for queries against Solr). This new dynamic marketplace was easily the heaviest usage of our Solr platform to date, so we were curious to see what sort of impact this was having on our servers.


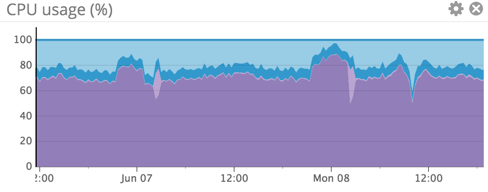
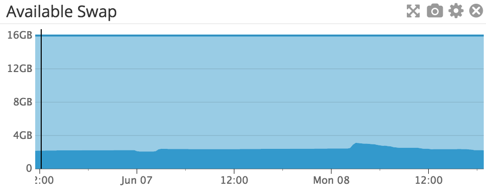
We were using all available RAM on the systems, swapping to disk, and utilizing almost all available CPU. Yikes! Our CPU is way high, and there’s enough memory pressure that we’re forcing swaps to disk. We had been collecting average response time metrics for requests to Solr on these nodes (our app nodes: old hardware, past its prime):

Crap. Over 100ms of response time on average for every Solr request. No wonder things were slow! This made it clear that it was time to upgrade.
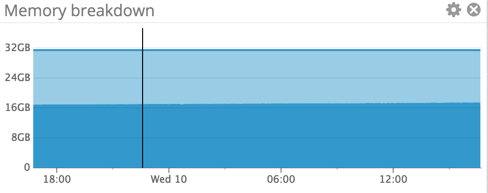
We spec’ed out some modern boxes which met our needs from a CPU/Memory perspective, and got them spun up and added them into the pool. What a difference! Here’s their server-side metrics:


Our CPU usage is around 25%, memory usage is holding steady, and there’s no swapping to be found. This lead to direct improvements in Solr response time, as you can see in the graph below

We cut our average Solr response time to around 20% of what it was originally. So, the fair question at this point is “What impact did this have on the site response time?” The answer: we cut our time-to-first-byte response time on Marketplace pages by half.

In addition to the evidence here, the proof was in the usage of the marketplace: it felt fast. This lead to increased engagement on these pages, as well as improved conversion rates. Awesome!
This performance gain helped our response time on other pages as well. We noticed improvements in response times across the board, including our Homepage, Product Pages, and Inshape, our ERP system for managing our orders in process.
We’re excited about the performance gains we’ve made with this change, and are making plans for future improvements across our technology stack.
