We decided that our very first service would be focused on Equipment Monitoring. This piece of core functionality would bring new data into our factories to improve their performance. While this data was important, it was also not on the critical path for the company, meaning we could take our time and get it right. Perfect.
The Problem

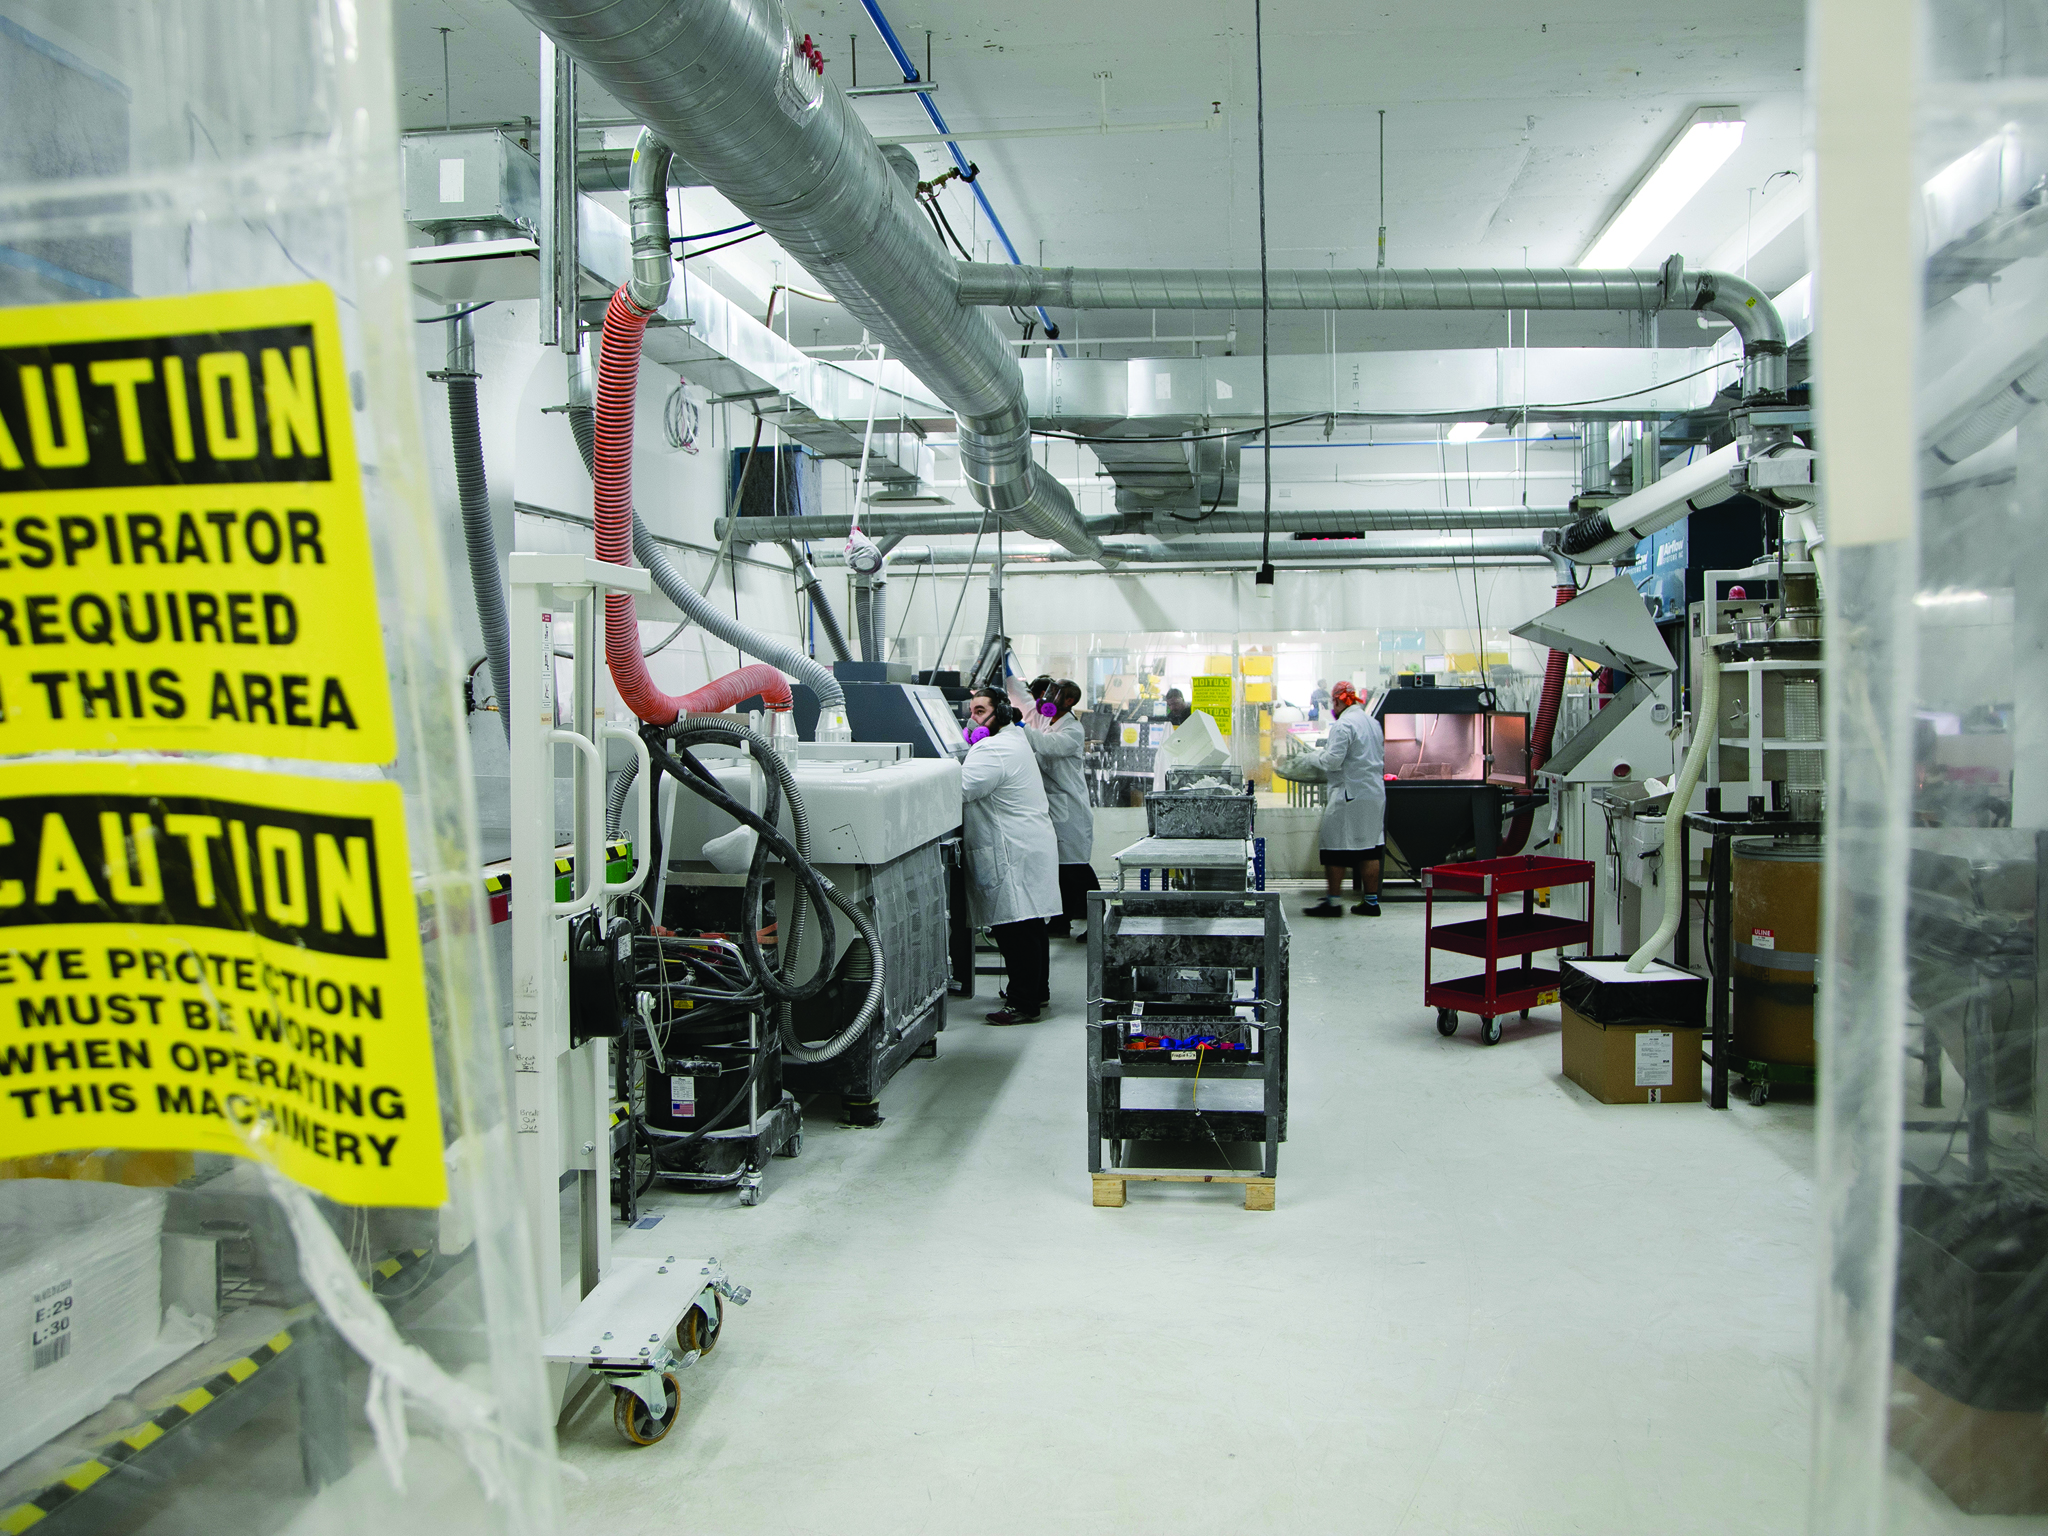
Shapeways runs two internal production facilities - one in Long Island City, New York, and the other in Eindhoven, Netherlands. These facilities each contain dozens of 3d printers from a variety of manufacturers, producing parts in a variety of materials based on their capabilities. As the “end user” of these machines, we’re at the mercy of the manufacturers to give us insight into machine performance. Unfortunately, most manufacturers don’t provide software to look at what’s happening inside the machine - they were effectively black boxes to us.
You can do a lot of process optimization when working with black boxes. You can streamline their input and output steps, and do your best to set them up for success based on previous experience with them. However, without being able to peer inside the box, you can never truly understand the performance characteristics of your equipment. Without understanding what really makes them tick, you can’t effectively optimize your systems
Here’s a quick example of why equipment efficiency is important. A quick note - all numbers here are for example purposes only, and are not reflective of costs at Shapeways. Let’s say you have a 3d printer. It costs you approximately $1000 per day to own - these costs are a combination of the cost of the machine, the service contract, materials used, the power consumed, and the percentage of space it takes up in your facility. This machine is capable of printing $900 worth of product in 8 hours. At peak efficiency (assuming that startup, cooldown, and cleaning activities are rolled into that estimate), this machine can produce $2700 of gross revenue a day. When you take out the cost of owning the machine, that’s $1700 in net revenues for the machine.
$2700 - $1000 = $1700
Not bad! Out of the $2700 we charged our customers for their products, Based on the machine alone, that’s a Gross Margin percentage of around 63%
$1700 / $2700 = .629
Wonderful. In this ideal case, our COGS (cost of goods sold) is the cost that it took to produce them - $1000. 63% margin sounds great! Now, this doesn’t account for other costs (Salaries and Benefits of employees, loans, shipping logistics, etc), but still - 63% margins on a physical good are pretty fat. For example, if you had the demand to fill 20 of these printers, you’d be making $34,000 a day in net revenue. That sounds like a good business to me!
Unfortunately, we don’t live in an ideal world. Anyone who’s run industrial equipment for a living will tell you, the ideal numbers rarely reflect reality. Let’s say that one of your machines crashes, knocking out one of your 3 runs. This leaves you with $1800 a day in revenue. Seems ok….but unfortunately, the cost of ownership of your machine remains at $1000 whether you’ve used it or not. So, running the same calculations above, you end up in a much worse place.
$1800 - $1000 = $800
$800 / $2700 = .296
You only end up making $800 in net revenue, leaving you with a gross margin of 30%. Scaled up across the 20 machines, this ends up earning you $16,000 a day in revenue. That’s less than half of your previous $34,000! Now, imagine the failure takes out two, or even all three builds. You quickly end up losing money on your printers.
Over our years of operating 3d printers, we’ve learned that the old adage “An ounce of prevention is worth a pound of cure” holds true. The sooner you can address issues that arise with your printers, the more efficiently they run, and the less frequently they crash. It was critical that we understand what’s going on inside the machines.
The Solution
The good news is that, while the manufacturers didn’t offer software to display this information, they usually had some method of accessing machine information. In the best case, they had documented APIs that we could use to query for the data. In less ideal scenarios, there were ways to access log files that we could parse after the fact, or sensors that we could build to retrieve information about the build. So, with these access methods and limitations in mind, we set out to figure what sorts of information would be useful.
We went to the source - our internal production teams, the end users of the data from this service. They let us know that they look at production data through two lenses - real-time, and historical. Real-time data is used to understand the current status of the machine - things like whether or not it’s printing, if it’s under maintenance, or if any of its operating parameters are outside of their norms. Historical data is used to establish normal operating parameters, calculate OEE and revenues, and to see how our printers perform as they age.
The other important dimension to consider for our data was common data vs specific data. Common data includes things such as print job ID, job runtime, name of job, value per job, etc. These data would be collected for every printer we would monitor, and would provide an apples-to-apples comparison model for disparate printers. The specific data is in some way specific to a printer or production process. This includes things such as SLS temperature bed, laser wattage, per-channel material usage for multi-material printers, and the like. These data were to be collected and stored alongside the printer so that we could reference it for possible deviations from the expected norms as we used our printers.
Design and Build
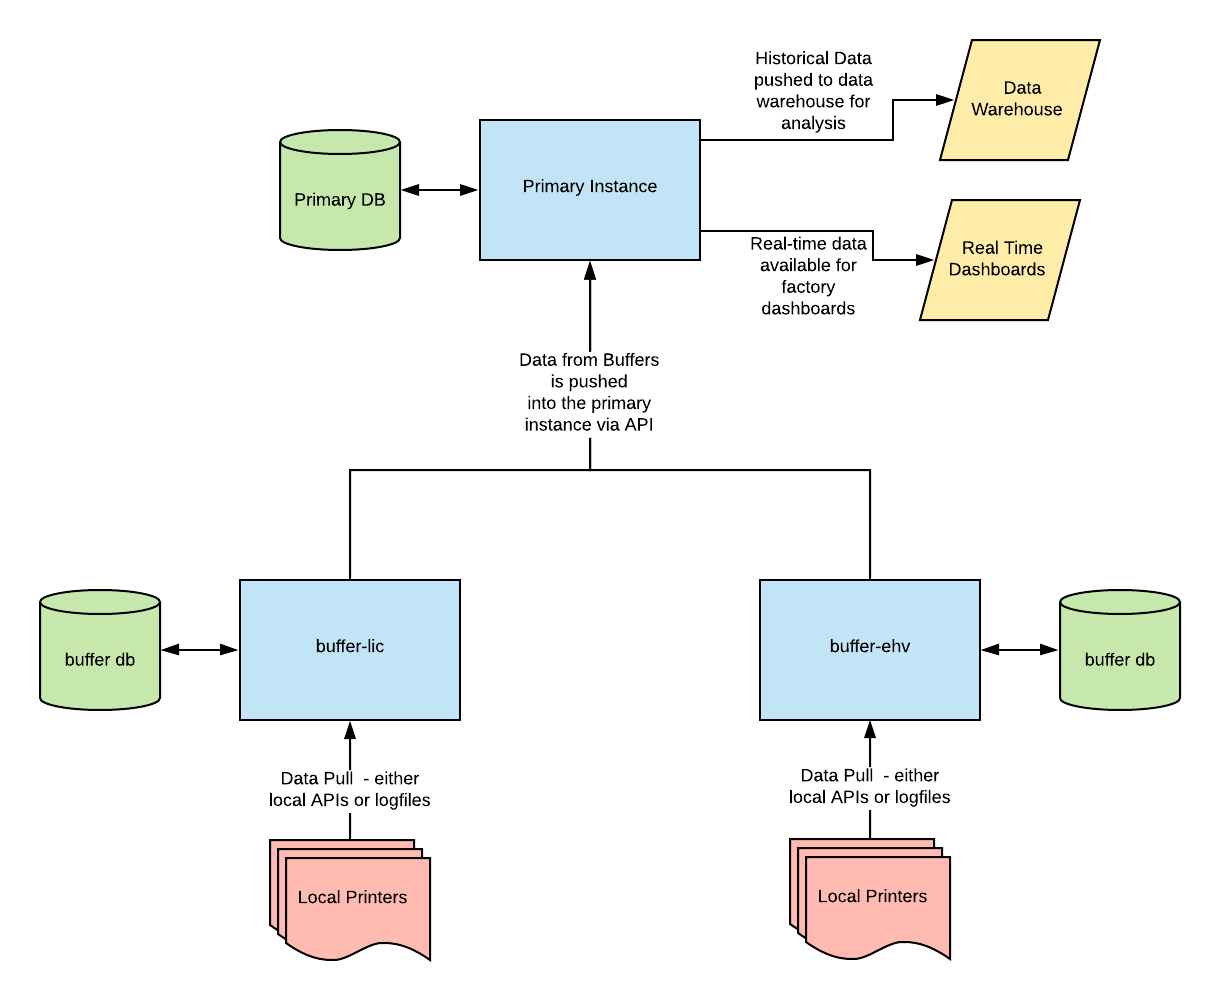
User stories and requirements in hand, it was time to model our service. Paraphrasing “Release it!” by Michael T. Nygard, a service is defined as “a collection of processes across machines that work together to deliver a unit of functionality.” Given the diversity of interactions with our printers, alongside the need for a central location to collect and collate data, we decided that our service would be split into two instance types - a primary, which would reside in one of our data centers, and a series of buffers, which would reside in our factories.

The Primary instance would act as the central repository for all data from all instances of the Equipment Monitoring, primary or buffer. The Primary instances knows about all printers in the system, including those externally accessible by API and those internally sequestered in the factory. In terms of equipment monitoring itself, the Primary instance would be responsible for retrieving printer information for those printers which provided web interfaces and APIs. In this instance, printers report their data back to the manufacturers database, and the manufacturer in turn provides that data for consumption over their APIs. The primary instance is a good fit for this, as we have firewall rules and permission lists in place in our datacenters to easily facilitate access to this data. The Primary instance also serves as an access point for other systems looking to retrieve equipment data.
As of this writing, there are two systems which access this data
- Our data pipeline tool, which extracts printer data and pushes it to our data warehouse for integration with data from other portions of our application for analysis. This result of these analyses are leveraged company-wide, by manufacturing, finance, and supply chain teams.
- Our real-time dashboards, which extract site-specific data (i.e., printers in a particular factory / production team / manufacturing cell) and display real-time status information about what’s going on with our printers. These are primarily leveraged by our manufacturing teams to understand their instantaneous status, or by me when I’m giving a presentation about how we made ‘em go :)
The Buffer instances, on the other hand, are site-specific instances which only know about the printers in their physical location. Buffers are responsible for communicating with printers that don’t provide nice, clean APIs for data retrieval. Since local access to the printers is required, and we don’t want to replicate our datacenter networking infrastructure in every one of our facilities to provide access, it was easier to have a locally running instance to directly access the printers on their local network. In addition to pulling job and status information from the machines themselves, the Buffer instances are responsible for periodically pushing their retrieved data to the Primary instance. In the interest of data consistency across instances (and sane debugging), we issue large blocks of primary keys for every data type to each Buffer and Primary instance. This ensures that we don’t have conflicting keys on coalescence on the Primary instance of our service, and also guarantees that whatever ID a job, printer, or sensor reading had on the Buffer will be the same as it is on the Master.
In addition to solving our networking issue, the Buffer instances make it possible for us to continue to collect job information even if our primary instance is unreachable. This protects us from failures in the datacenter, in the routing between the datacenter and the factories, ISP issues at the local factory, or failures in the Primary service instance. The Buffers can plug right along doing their thing, storing up jobs, and will push them all to the Primary instance once it’s back online. What’s more, the Buffers also provide their own real-time status dashboards for the manufacturing teams to leverage. This ensures that our manufacturing teams can continue to operate with knowledge of their local systems even if the Primary instance is offline. This strategy is leveraging the Circuit Breaker and Bulkhead patterns to create an anti-fragile system capable of self-healing, increasing reliability and decreasing the need for our developers to spend time diagnosing issues with the system.
The Result

The result of this service was far deeper insights into the performance of our machines than we’d had in the past. These data, provided to our specific machine maintenance teams, helped us lower our manufacturing defect rate, raise our OEE and Gross Margins, and ensured that we delivered on our promised lead times to our customers. In return, the fast development of this service (which took about a month to design, build, and deploy) helped us gain buy-in for microservices at Shapeways, as it demonstrated the speed and value they could bring to our business.
That’s the story of our very first service, Equipment Monitoring. It’s a fairly straightforward problem statement with a clear, mechanical solution - we implemented it using python3 and flask, my preferred stack for getting stuff done fast. The simplicity of the problem at hand (retrieve data, coalesce data, report data out) gave us the opportunity to flex our service reliability muscles, and ended up setting the bar for service uptime and antifragility at Shapeways quite high.
