A Brave New World - ModelIQ

This is the seventh in a series of posts about the transition from a monolith to microservices that I led at Shapeways as the Vice President of Architecture. I hope you find it useful! You can find the series index here.
Our Intrepid Hero Sallys Forth

At this point, we had implemented two services - Equipment Monitoring and Sales Tax, and were running them on production. We’d made a few mistakes along the way, and learned plenty about the differences in running services vs monoliths in production. In short, we felt ready for prime-time - our first user-facing service for our new business-focused platform.

Selecting a Service

We were fortunate to have some valuable user input into this process - an actual customer. We had recently signed a commercial agreement with our very first customer on our Powered by Shapeways platform, Loctite, who wanted to leverage our new Powered by Shapeways platform to sell their new 3d printing materials. Based on our requirements conversations with Loctite, we identified Model Upload as a key piece of functionality required by their end customers. While we had existing Model Upload and Checkout functionality on shapeways.com, it was determined that the existing Checkout feature was far closer to what Loctite envisioned than the existing Upload feature. Therefore, it was determined that we’d work on Powered by Shapeways Model Upload first, and Checkout second.

An aside - this type of direct, actionable feedback from a paying partner is absolute gold - there’s no stronger prioritization signal available. It’s worth your time to have these types of honest conversations with your business partners, particularly early in a products development cycle. Often, a 30 minute phone call can replace a week of research.

Defining the Business Need

What a Team!

Model Upload isn’t just something that Loctite wanted - it’s also one of the core pieces of our business, and what differentiates Shapeways’ from many of our competitors. Our model processing system (MP) enables us to provide near real-time printability analysis, image rendering, and pricing to our end users in a wide variety of materials. This is the first true high-intent step in our conversion funnel - a user that has a model file ready to go is extremely likely to make a purchase decision provided that the experience meets their expectations.

Now, our existing upload flow worked, but it was built to support our old business, and suffered from performance issues and a tightly coupled design. Some issues included:

  • No ability to filter materials. Our existing flow was designed to sell every material that Shapeways has to offer. Most partners want to center the user experience around their materials, not to promote other materials that they don’t offer.
  • Tightly coupled with our model processing system. The original Model Upload would read data inserted in the ActiveMQ queues of our MP system, and leveraged their content to drive the front end. This type of tight coupling required that both systems exist on the same network, which would be impossible if a partner ever wanted an on-site or private installation of Powered by Shapeways.
  • Bloated data objects. Over the years, we continued to add more and more data to our model objects. This included categorization, ability to sell to others, commercial versioning information, and comments left by consumers who had purchased. These data are of no use to our new customer base, and required significant database cycles to compute.

Building the Service

It was time to design our new Model Upload service, or ModelIQ (short for Model Instant Quote). After some initial discovery, we realized that ModelIQ was, largely, a frontend application built on top of our existing APIs. ModelIQ has three prime pieces of functionality:

  1. Upload a model to Shapeways
  2. Retrieve pricing information about that model in materials defined by the partner
  3. Add a model in a material to a user cart for purchase

The public facing Shapeways API provides all the required functionality for uploading a model and retrieving its pricing information. Further, the existing Shapeways e-commerce experience, while by no means perfect, was more than capable of managing the cart and checkout experience for the end customer. Since we were using the existing API to upload the model to Shapeways, our cart was aware of the model and able to execute the purchase.

Choosing to use our existing APIs was not only a matter of convenience: they also act as an interface between our existing Shapeways.com infrastructure and our new Powered by Shapeways platform. Part of the trick with building Powered by Shapeways was that we needed to leverage the existing functionality of Shapeways - we weren’t going to rebuild 12 years of software overnight. These existing APIs gave us a portal to access this functionality without tightly coupling it into our new platform. That way, once we’ve replaced the monolith itself, all we have to do is point our ModelIQ to the new service endpoints instead of the old monolith ones - no functional change required in ModelIQ.

Green Field Frontend Development

Our monolithic approach to Shapeways.com, unfortunately, wasn’t constrained to our backend development. We had giant CSS and JS files which defined features used willy-nilly across our experience. While we had made efforts to componentize parts of our front-end, we never had time nor resources to devote to really chipping away at the monolith.

Presented with this new service offering, our front-end focused developers were excited to rectify the mistakes of the past. They opted to use the vue.js framework for our new frontend services, and set about defining a reusable component library for common components. In short order, they had components for model upload, model information, pricing, add to cart buttons, and dynamic headers and footers which would adjust to a partner’s brand details. These components are the actual driving force behind ModelIQ - they pass user actions and data to the backend, which in turn orchestrates API calls to the monolith and returns the data back to the front end.

You can try ModelIQ out for yourself right here! I encourage you to compare it to our older upload flow, which can be found here.

Velocity

I want to end with a note on velocity, specifically development velocity. While microservices themselves don’t necessarily increase velocity as a matter of fact, they can definitely improve it in specific situations. Take our situation for example- we had a ton of existing functionality wrapped up in a giant monolith. The functionality is sound, but the architecture is weak - changes to the monolith itself take a ton of time, as code is tightly coupled, and changes are riddled with unintended consequences.

In a situation like this, the cost of changing or implementing a new feature in the monolith is high. However, if we can leave the monolith at rest, and simply leverage its existing functionality through APIs to drive our new features, the cost to implement drops dramatically. In fact, this is the best of both worlds - you can leverage production-hardened code in a new, baggage-free application without fear of regression or unexpected behavior.

We re-worked our original Model Upload in 2017. It took 4 developers close to a year to implement all of the various features. ModelIQ is less feature-rich than our existing upload experience, but provides the exact same functionality that matters - users can upload, price, and purchase. It was built from scratch by two developers in a single quarter.

That’s an improvement.

Microservices and Vendors - Managing Risk

This is the sixth in a series of posts about the transition from a monolith to microservices that I led at Shapeways as the Vice President of Architecture. I hope you find it useful! You can find the series index here.
Would You Really Make a Snickers?

When discussing microservices, the common frame of reference is for internally-developed applications. While core functionality is certainly the most important part of your business (and therefore the most critical to get right), I’d ask you to spare a thought for functionality that you’re outsourcing to others. While things like tax collection, payment acceptance, and logistics services may not be the most critical portions of your stack, getting their implementation right the first time will pay dividends in the future.

In a previous post, I described two services that we were going to implement - tax, and equipment monitoring. This post is ostensibly about the implementation of that service, but really it’s simply a convenient example to illustrate the process we used to decouple our vendor from our application and de-risk our choice to outsource this functionality.

Choosing to Use a Vendor

There are a ton of good reasons to outsource functionality to a SaaS provider - they provide full functionality up-front, eliminate the need to spend development capacity (and cost!) implementing something that already exists, and permit your team to focus on delivering the core business functionality required to move your company forward.

However, it’d be naive of us to ignore the drawbacks to leveraging a 3rd party provider. For one, they cost money on an ongoing basis - you have to pay them every month, vs just paying up-front for the development time if you’d have built it yourself. Vendors can also change the nature of the agreement every time a contractual period expires, either increasing costs or removing functionality from the current payment tier you’re using. Finally, vendors come with risks of their own - both the technical (maintenance windows, unplanned outages, etc) and the existential (companies fail all the time). If you’ve done the math, and determine that leveraging a 3rd party vendor for a portion of your business, then you’d be well-served to de-risk that vendor in your software architecture.

Microservices for Vendors

De-risking the choice of using a vendor means striving towards a system that is resilient to the vendor going away. The simplest way to achieve this is to decouple the usage of the vendor from the core functionality that they’re providing. Microservices are a natural fit for this - you can create a service that offers an interface for the core functionality, and then plug the vendor into the back of the service to actually provide the functionality detailed in the service. This natural decoupling allows for you to change vendors without impacting the other services in your mesh.

Define Core Functionality

We leveraged this pattern of decoupling to implement our Sales Tax service. Our first step was to define the core functionalities that the Sales Tax service would provide. We defined three pieces of functionality that the service would implement

  1. Provide Sales Tax rates based on customer shipping address. This service needs to provide up-to-date rates for global taxes, including US Sales Tax, VAT, and GST.

  2. Allow for locale-based tax exemption, and provide a mechanism for users to submit their government documents for automated tax exemption on our platform. This needs to work for at least US users, where exemption is more complex and based on individual states.

  3. Automatically submit monthly tax reports to state governments. Our finance organization is not staffed to manually file monthly taxes in all 50 states, where we are now required to collect tax due to Wayfair vs South Dakota.

With these core functionalities defined, we now have a requirements list we can use to evaluate potential partners. We opted for Avalara, though there are several other companies in the landscape that provide similar services.

The Provider Pattern

Functionality defined and vendor in place, it’s time to talk about the design of this service. The internally facing API and persistent storage of a vendor-based microservice are no different than any other service in the system - you’ll face the same decisions around API format, storage choice, and data model. Where things get a bit different is the provider interface.

Architecture of our Tax Service

The Provider Pattern calls for us to define a generic interface for a provider, which is implemented by providing service (in this case, our vendor). The previously described core functionalities represent the interface - we simply had to build a mapping from that interface to Avalara’s APIs for retrieving tax rates, filing taxes, and handling user tax exemption. With this in place, we now had a tax service which was capable of handing our own internal taxation logic (where we capture tax vs not, who is exempt vs not), with the actual retrieval of rates, filing of tax documents, and process for exemption handled by Avalara. If we have to change tax providers some day, all we’ll need to do is implement their portion of the provider interface.

This decoupling makes it so that a change in vendor has no knock-on effects to our service mesh beyond the individual service that is implementing the vendor API. Compare this, say, to implementing the Avalara API everywhere that we require sales tax. If we changed providers, we’d be forced to modify every single place we’d implemented the Avalara API, which would both take longer and require more teams to become involved. De-risking behavior enables us to use our vendor with confidence that, if they go away, we’ve minimized our risk of impact to our platform.

The Guinea Pig - Equipment Monitoring

This is the fifth in a series of posts about the transition from a monolith to microservices that I led at Shapeways as the Vice President of Architecture. I hope you find it useful! You can find the series index here.
I would really rather not?

We decided that our very first service would be focused on Equipment Monitoring. This piece of core functionality would bring new data into our factories to improve their performance. While this data was important, it was also not on the critical path for the company, meaning we could take our time and get it right. Perfect.

The Problem

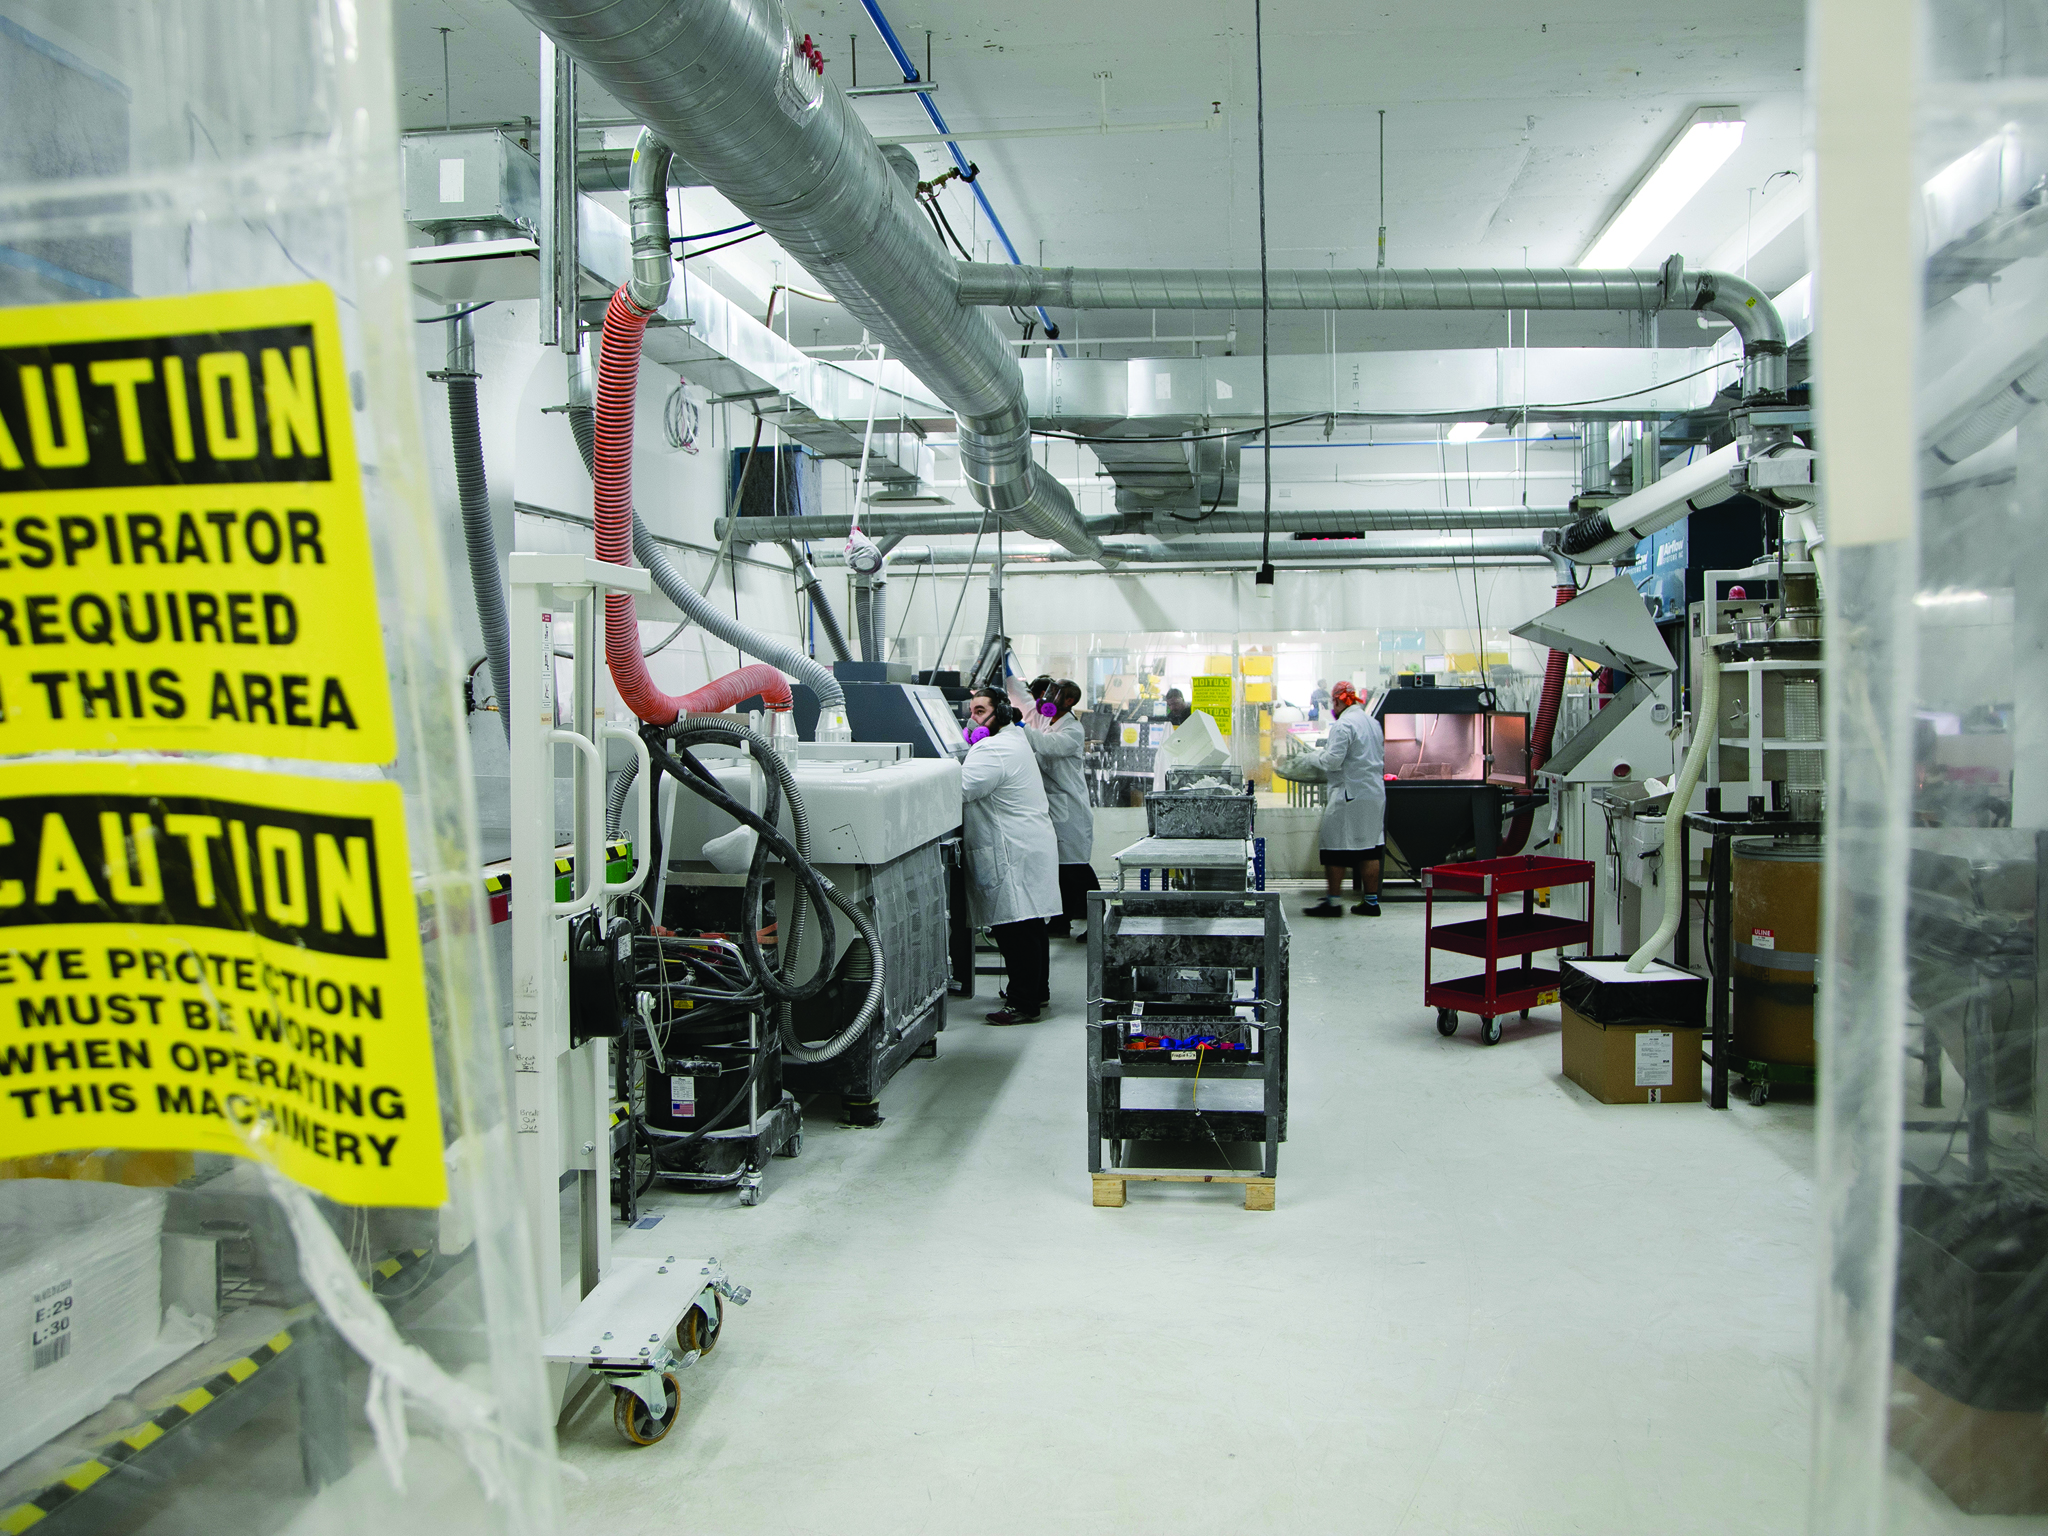
The SLS Breakout Room - Shapeways LIC

Shapeways runs two internal production facilities - one in Long Island City, New York, and the other in Eindhoven, Netherlands. These facilities each contain dozens of 3d printers from a variety of manufacturers, producing parts in a variety of materials based on their capabilities. As the “end user” of these machines, we’re at the mercy of the manufacturers to give us insight into machine performance. Unfortunately, most manufacturers don’t provide software to look at what’s happening inside the machine - they were effectively black boxes to us.

You can do a lot of process optimization when working with black boxes. You can streamline their input and output steps, and do your best to set them up for success based on previous experience with them. However, without being able to peer inside the box, you can never truly understand the performance characteristics of your equipment. Without understanding what really makes them tick, you can’t effectively optimize your systems

Here’s a quick example of why equipment efficiency is important. A quick note - all numbers here are for example purposes only, and are not reflective of costs at Shapeways. Let’s say you have a 3d printer. It costs you approximately $1000 per day to own - these costs are a combination of the cost of the machine, the service contract, materials used, the power consumed, and the percentage of space it takes up in your facility. This machine is capable of printing $900 worth of product in 8 hours. At peak efficiency (assuming that startup, cooldown, and cleaning activities are rolled into that estimate), this machine can produce $2700 of gross revenue a day. When you take out the cost of owning the machine, that’s $1700 in net revenues for the machine.

$2700 - $1000 = $1700

Not bad! Out of the $2700 we charged our customers for their products, Based on the machine alone, that’s a Gross Margin percentage of around 63%

$1700 / $2700 = .629

Wonderful. In this ideal case, our COGS (cost of goods sold) is the cost that it took to produce them - $1000. 63% margin sounds great! Now, this doesn’t account for other costs (Salaries and Benefits of employees, loans, shipping logistics, etc), but still - 63% margins on a physical good are pretty fat. For example, if you had the demand to fill 20 of these printers, you’d be making $34,000 a day in net revenue. That sounds like a good business to me!

Unfortunately, we don’t live in an ideal world. Anyone who’s run industrial equipment for a living will tell you, the ideal numbers rarely reflect reality. Let’s say that one of your machines crashes, knocking out one of your 3 runs. This leaves you with $1800 a day in revenue. Seems ok….but unfortunately, the cost of ownership of your machine remains at $1000 whether you’ve used it or not. So, running the same calculations above, you end up in a much worse place.

$1800 - $1000 = $800

$800 / $2700 = .296

You only end up making $800 in net revenue, leaving you with a gross margin of 30%. Scaled up across the 20 machines, this ends up earning you $16,000 a day in revenue. That’s less than half of your previous $34,000! Now, imagine the failure takes out two, or even all three builds. You quickly end up losing money on your printers.

Over our years of operating 3d printers, we’ve learned that the old adage “An ounce of prevention is worth a pound of cure” holds true. The sooner you can address issues that arise with your printers, the more efficiently they run, and the less frequently they crash. It was critical that we understand what’s going on inside the machines.

The Solution

The good news is that, while the manufacturers didn’t offer software to display this information, they usually had some method of accessing machine information. In the best case, they had documented APIs that we could use to query for the data. In less ideal scenarios, there were ways to access log files that we could parse after the fact, or sensors that we could build to retrieve information about the build. So, with these access methods and limitations in mind, we set out to figure what sorts of information would be useful.

We went to the source - our internal production teams, the end users of the data from this service. They let us know that they look at production data through two lenses - real-time, and historical. Real-time data is used to understand the current status of the machine - things like whether or not it’s printing, if it’s under maintenance, or if any of its operating parameters are outside of their norms. Historical data is used to establish normal operating parameters, calculate OEE and revenues, and to see how our printers perform as they age.

The other important dimension to consider for our data was common data vs specific data. Common data includes things such as print job ID, job runtime, name of job, value per job, etc. These data would be collected for every printer we would monitor, and would provide an apples-to-apples comparison model for disparate printers. The specific data is in some way specific to a printer or production process. This includes things such as SLS temperature bed, laser wattage, per-channel material usage for multi-material printers, and the like. These data were to be collected and stored alongside the printer so that we could reference it for possible deviations from the expected norms as we used our printers.

Design and Build

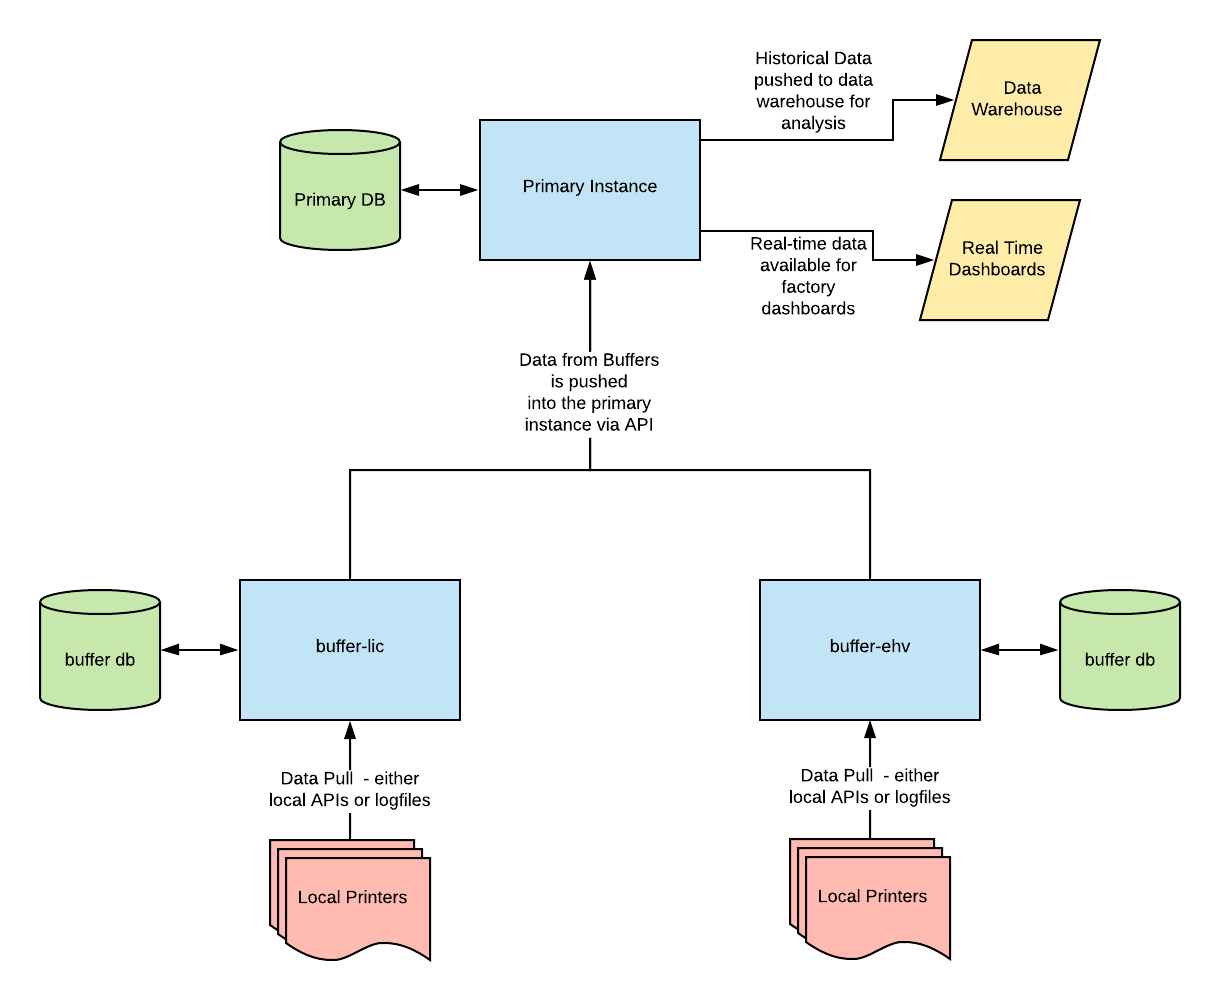
User stories and requirements in hand, it was time to model our service. Paraphrasing “Release it!” by Michael T. Nygard, a service is defined as “a collection of processes across machines that work together to deliver a unit of functionality.” Given the diversity of interactions with our printers, alongside the need for a central location to collect and collate data, we decided that our service would be split into two instance types - a primary, which would reside in one of our data centers, and a series of buffers, which would reside in our factories.

The Service Layout for EMS

The Primary instance would act as the central repository for all data from all instances of the Equipment Monitoring, primary or buffer. The Primary instances knows about all printers in the system, including those externally accessible by API and those internally sequestered in the factory. In terms of equipment monitoring itself, the Primary instance would be responsible for retrieving printer information for those printers which provided web interfaces and APIs. In this instance, printers report their data back to the manufacturers database, and the manufacturer in turn provides that data for consumption over their APIs. The primary instance is a good fit for this, as we have firewall rules and permission lists in place in our datacenters to easily facilitate access to this data. The Primary instance also serves as an access point for other systems looking to retrieve equipment data.

As of this writing, there are two systems which access this data

  • Our data pipeline tool, which extracts printer data and pushes it to our data warehouse for integration with data from other portions of our application for analysis. This result of these analyses are leveraged company-wide, by manufacturing, finance, and supply chain teams.

  • Our real-time dashboards, which extract site-specific data (i.e., printers in a particular factory / production team / manufacturing cell) and display real-time status information about what’s going on with our printers. These are primarily leveraged by our manufacturing teams to understand their instantaneous status, or by me when I’m giving a presentation about how we made ‘em go :)

The Buffer instances, on the other hand, are site-specific instances which only know about the printers in their physical location. Buffers are responsible for communicating with printers that don’t provide nice, clean APIs for data retrieval. Since local access to the printers is required, and we don’t want to replicate our datacenter networking infrastructure in every one of our facilities to provide access, it was easier to have a locally running instance to directly access the printers on their local network. In addition to pulling job and status information from the machines themselves, the Buffer instances are responsible for periodically pushing their retrieved data to the Primary instance. In the interest of data consistency across instances (and sane debugging), we issue large blocks of primary keys for every data type to each Buffer and Primary instance. This ensures that we don’t have conflicting keys on coalescence on the Primary instance of our service, and also guarantees that whatever ID a job, printer, or sensor reading had on the Buffer will be the same as it is on the Master.

In addition to solving our networking issue, the Buffer instances make it possible for us to continue to collect job information even if our primary instance is unreachable. This protects us from failures in the datacenter, in the routing between the datacenter and the factories, ISP issues at the local factory, or failures in the Primary service instance. The Buffers can plug right along doing their thing, storing up jobs, and will push them all to the Primary instance once it’s back online. What’s more, the Buffers also provide their own real-time status dashboards for the manufacturing teams to leverage. This ensures that our manufacturing teams can continue to operate with knowledge of their local systems even if the Primary instance is offline. This strategy is leveraging the Circuit Breaker and Bulkhead patterns to create an anti-fragile system capable of self-healing, increasing reliability and decreasing the need for our developers to spend time diagnosing issues with the system.

The Result

A Sample Dashboard showing Printer Performance

The result of this service was far deeper insights into the performance of our machines than we’d had in the past. These data, provided to our specific machine maintenance teams, helped us lower our manufacturing defect rate, raise our OEE and Gross Margins, and ensured that we delivered on our promised lead times to our customers. In return, the fast development of this service (which took about a month to design, build, and deploy) helped us gain buy-in for microservices at Shapeways, as it demonstrated the speed and value they could bring to our business.

That’s the story of our very first service, Equipment Monitoring. It’s a fairly straightforward problem statement with a clear, mechanical solution - we implemented it using python3 and flask, my preferred stack for getting stuff done fast. The simplicity of the problem at hand (retrieve data, coalesce data, report data out) gave us the opportunity to flex our service reliability muscles, and ended up setting the bar for service uptime and antifragility at Shapeways quite high.

Identifying our First Services

This is the fourth in a series of posts about the transition from a monolith to microservices that I led at Shapeways as the Vice President of Architecture. I hope you find it useful! You can find the series index here.
Progress sometimes comes with tears.

Application map in hand, we were ready to identify our first functional candidate for conversion to a service. If you haven’t yet, now’s the time to reference the previous article in this series for the definitions of core vs supporting functionalities. I came up with two guiding principles for selecting service candidates in the early days. The first service candidates should be either

  • Support functionality that’s either poorly implemented, or has a demonstrably superior 3rd party provider.
  • Non-essential core functionality that we haven’t yet implemented

As this was our first service, I wanted permission for us to make mistakes. By choosing either a support functionality that already exists or a core service that we haven’t implemented, we’re giving ourselves permission to extend deadlines, change implementation strategies halfway, and generally experiment with building, deploying, and running microservices. Basically, I wanted to develop our first service without the pressure of getting it right the first time.

Looking for candidates

In looking for candidates, we decided to take an outside-in approach: starting from the external scaffolding of our monolith to reimplement as services, much like peeling an onion. The idea being that, as more and more functionality is peeled off the monolith and reimplemented as services, the monolith is slowly whittled away and eventually replaced at the core. This is a version of the Strangler Pattern, where the new implementation move in like an invasive species moves into a new environment and takes over from the natives species.

Rather than choosing between a core and a supporting service, I decided that I would seek out one of each to build. We had the capacity on the development team to start with two small services, and I wanted to build as much momentum as I could in the organization towards this architectural shift. To that end, I wanted to deploy services that would improve the work lives of folks at Shapeways outside of the software team, the idea being that getting folks around the company excited about what services could do for them, I was building support for allocating more resources to the monolith->service transformation. This was admittedly a bit of a political play, but if you think that you can get things done by the strength of ideas alone, I’ve got a few bridges on the East River looking for new owners.

Support Functionality

For supporting functionality candidates, we had a few options

  • Tax Collection - We were managing global tax rates and exemption statues, with our own internally managed tax tables. These tables were manually updated monthly by a developer using SQL. There are several companies offering rates and exemptions as a service.

  • Shipping and Logistics - We were using the Shippo, UPS, and EasyPost APIs in separate places throughout our application to manage shipping label creation, address validation, leadtime calculation, and shipping rates. Having several tools to do this resulted in imperfect addresses, which sometimes lead to shipments begin rejected by one service that were fine by another.

  • Payments - we had individually implemented the APIs for Paypal and Braintree prior to their merger, meaning we had a few different payment options to manage. Furthermore, we were manually handling bank transfers and had no option for ACH, which put a ton of workload on our accounting team.

After some consideration, we decided to build a tax collection service. In addition to the obvious opportunity for improvement on our existing implementation, there were two other driving factors in its selection

  1. South Dakota vs Wayfair was decided in favor of South Dakota. In short, this meant that companies would have to charge sales tax in ALL US States and Territories rather than just the ones where they had nexus (business presence). For Shapeways, this meant that instead of only charging tax in New York State, Washington State, and the District of Columbia, we would instead have to charge…everywhere. Not only did this increase the number of tax tables that we would have to maintain exponentially, but it also required us to now file taxes in effectively 20x the number of places. We had already identified Avalara as a vendor who could help both manage rates and file taxes for us automatically - this sealed the deal.

  2. We had begun launching external shopping experiences that needed to charge sales tax. These were implemented in Shopify, and therefore couldn’t leverage our internally managed tax tables because there was no connectivity to do so. We were instead doing a poor job of estimating taxes to be collected, and creating financial uncertainty for the company.

Core Functionality

In terms of core functionality, there was a slimmer set of options. We immediately ruled out anything that was going to impact the ability of employees, vendors, or customers to engage with our platform. This ruled out….well, almost everything. However, there was one piece of functionality that we’d always wanted to build but never did - real-time equipment monitoring.

The 3D printing space has a spectrum of production technologies and companies making them. All machines have a few things in common - they manufacture products, they take in consumable materials, and run for some time with either successful or failed jobs. Some more modern companies provide APIs from which to extract this information. Others have logfiles which you can process to glean data. Others still require more innovative approaches, such as building external sensors and embedded devices to track job data.

We had long wanted to build an application that understood how to consume the available data we had from all machines and unify it with our ERP system to provide a complete picture of our production environment. As this required a specialized understanding of each machine in our stable, plus would require a new section of our monolith in the old world, we never got around to it. However, this was a perfect candidate for our first core service. It would provide new data about the production of our parts that we could unify with our existing ERP data, giving both our internal production teams and our customers deeper insight into the quality of the parts that we were producing

We had identified our first two services - Tax, and Equipment Monitoring. The next post will focus on our approach to implementing the equipment monitoring service.

Mapping the Application

This is the third in a series of posts about the transition from a monolith to microservices that I led at Shapeways as the Vice President of Architecture. I hope you find it useful! You can find the series index here.

The decision to move to microservices: made. The strategic leadership role: filled (by me), Now, it’s time to start the fun stuff - coming up with a plan to make this transition.

In the case of Shapeways, we were starting with the software equivalent of a Warboy War Rig from Mad Max: Fury Road. Over the years, the base application had pieces of functionality bolted on to serve one business need or another. And, like a War Rig, while the additions didn’t necessarily belong on the application in the first place, it was hard to deny that the end result was both functional and kinda cool.

Unwieldy and Cobbled Together? Yes. Cool? Also yes.

Pulling this apart was a daunting task. So, rather than blindly disassembling to find connection points, I took a product-focused approach and asked: What were the key user functions that this application provided? Turns out, there were a few:

  • Model Upload - the ability for a user to upload a 3D model to shapeways. We process the model to determine printability in all our materials, and price in each.

  • Order Placement - the ability for a user to place an order on our system. This is basic ecommerce functionality, but also critical to the business.

  • User Profiles - a place for our users to track their models, orders, and manage their personal data. This includes saved payment methods, shipping addresses, and tax exemption details if appropriate.

  • Marketplace - this is where our users place their own creations for sale. This includes managing their digital shops, designer markup, and product detail pages.

  • Inshape - our ERP system responsible for receiving orders, tracking them through production, and fulfilling them to our customers. Inshape is an entire application unto itself with layers of complexity, so we decided to consider the mapping of its key features separately. This work will be covered in a separate post later in the series.

Armed with this mapping, we had a much clearer picture of potential future service functionalities. The next step was to come up with an approach to getting started with services. Since we were starting with an existing application that was designed to serve a very specific purpose (facilitating the production of 3D printed parts), we chose to separate functionalities of our system into two groups: core, and support.

Core functions would be the ones specific to our industry and team - some examples are

  • determining 3d file printability and pricing,
  • preparing and optimizing 3d files for production,
  • maintaining an effectively infinite catalogue of Just-In-Time manufacturable parts.

Support functions would be systems required to operate this business, but not core to what we do - things like

  • tax calculation and exemption
  • checkout and payment collection
  • hosting a marketplace
  • financial record keeping

Put more bluntly: core functions were things that made us special, whereas support functions were things we could buy or leverage from the OSS community.

Once we had a first pass at functionality lists, and a mental model by which to sort them, we started to think about how they all tied together. Our goal was to identify functions that had high reuse potential - if we built it once, we’d be able to plug it into multiple portions of our application to solve problems. The next post in the series will focus on this process.