Shapeways Skunkworks: The Coyote Framework

Originally posted on the Shapeways Tech blog

It’s a common enough idea: Where there’s software, there’s bugs. Whether you’re of a technical bent or not, you’ve almost certainly experienced a software bug in your life. From programs randomly crashing, to your favorite mobile game not recognizing your latest achievement, bugs have one commonality: they create a lousy (or, at the very least unexpected) user experience.

As developers, we strive to release high-quality software for our users. We also want to do it fast. But, building software fast can be a scary business: how can you know it’s right? How can you prevent regressions? The not-so-revolutionary answer to this is testing. Preferably fast, accurate, and repeatable testing. Generally, this is automated in the form of unit tests and integration/functional tests. The unit testing world is pretty well fleshed out, with xUnit style libraries existing for most major languages. The world of functional testing, particularly for the web, is a bit less feature-rich from a development standpoint.

The Trouble with Functional Testing

Waiting for Functional Testing


Functional tests on the web have somewhat of a bad rap. They’re seen as being unreliable or flakey, and hard to debug and understand if you didn’t write them yourself. They’re slow, not taking advantage of setup data, and are hard to track failures without a human watching the screen . Finally, they put downward pressure on feature development, as any new feature or improvement will require that the tests are updated to reflect these changes.

The problems mentioned above are real. However, the reason they occur isn’t a fundamental flaw in functional testing and associated tools, but with how developers approach the way functional tests are written. For many, testing is a task to be completed, not software to be designed. Minimal effort is preferred, leading to copy/paste code snippets everywhere, creating duplication, which makes it quite the task when the time comes for maintenance. Running the tests can take a long time, as they’re often run against slow pre-production hardware, which leads to longer load times, and reduced interest in running them at all.

The Goal

We decided to solve these problems by building a framework. The goal of the Coyote framework is to remove the burden from functional testing. It makes it easy to write, read, debug, and update functional tests. It’s also designed to increase the speed of your tests via enabling fast creation of setup data, so that you can focus your tests on actually testing your site, not jumping through hoops to create setup data.

Coyote?

Chasing Greatness


Our PHP framework which we use for Shapeways.com is called Roadrunner, as it’s designed to be fast. When the time came to choose a name for the framework that was emerging for testing at Shapeways, Coyote was a natural fit. We’ve got a few other hat tips to Warner Brothers in our pipeline as well, which I look forward to sharing later.

Sounds Cool. How does it work?

I’m glad you asked :) Coyote provides base classes for page objects, wraps and manages interactions with Selenium Webdriver and python’s requests library, and gives you strong logging and debugging features for your tests.

Page Objects

Coyote is designed to follow the Page Object pattern. The big win here is that each page (or reusable component, like the login modal) and its interactions are encapsulated in a single class. That means that, if you change the behavior or design of a component or page, you only have to reflect that change in your test code in one place. This removes a lot of the downward pressure on change.

The other win for page objects is that they allow you to abstract the page interaction code (find this element, enter that text, click that button) from the behavior, say “log in”. So instead of test code that looks like this:

  username = webdriver.find_element('loginUsername')
  username.send_text('matt')
  password = webdriver.find_element('loginPassword')
  password.send_text('PinkPonyPinkPony')
  webdriver.find_element('loginButton').click()

You get this:

  login_page.enter_username('matt')
  login_page.enter_password('PinkPonyPinkPony')
  login_page.click_login()

Coyote introduces a convention, site objects, which are used to group several interactions (even across several pages) at once. For example, the above page object interactions would be rolled into a single function in a site object with a prototype like this:

  def login(username, password)

The true benefit of this pattern is realized when your tests go from being a mess of calls to webdriver (or your interaction tool of choice) to being behavioral descriptions. As an example, if you wanted to write a test that logged in and added an item to your cart, the test code would simply be

  login('matt', 'PinkPonyPinkPony')
  visit_product_page('SomeProductId')
  add_to_cart()

This makes it clear what the test is doing up front, and where it’s falling over when it fails.

Web Interactions

Coyote also contains wrappers around Webdriver and Requests, for browser-based and raw HTTP communications.

WebdriverWrapper handles common exceptions that Webdriver does not, as well as provides convenience methods for dealing with asynchronous requests. By doing this, it prevents a large number of webdriver-related test flappyness, specifically around stale DOM exceptions. It also provides excellent debugging output, including taking a screenshot w/ the stack trace overlaid on top of it for later review and headless debugging.

Additionally, WebdriverWrapper provides convenience wrappers around webdriver’s “find” constructs, as well as Locators, first-class objects representing HTML elements to be searched. These are intended to be contained within a Page Object,in a locators class. For example, here are the locators for the Page Object representing our [Developer Portal[(http://developers.shapeways.com)

  class locators(object):
   get_started_button = Locator('css', '.action-button.solo', 'main button to get started')

With locators stored like this, your calls to find elements go from this

  def is_page_loaded(self):
   '''Tests if page is loaded'''
   return self.webdriver.find_element(By.css, '.action-button.solo')

to this

  def is_page_loaded(self):
   '''Tests if page is loaded'''
   return self.dw.is_present(self.locators.get_started_button)

This may not seem like much, but it becomes indispensable when you have to change a locator that is used multiple times per page. Locators make this type of refactoring a breeze.

RequestDriver is a wrapper around python requests. In addition to the standard HTTP stuff that requests does, RequestDriver provides convenience methods around session management and cookie manipulation. The purpose of this module is twofold: it lets you create setup data for tests really quickly, and it allows for performing integration-style tests where you need ’em. The big one here is setup data time: instead of having to rely on pre-created data (or on webdriver to generate it), you can simply hit the relevant http endpoints. This both enables you to get setup data created fast, and ensures that it’s created in the same way as it would be by the web interactions, since you’re using the same endpoints. Solid.

Here’s an example RequestDriver call. You’ll notice it looks almost exactly like a python requests call….because it basically is :)

  response = self.rd.request(
        uri=ShapewaysUrlBuilder.build_login_page_url(
             host=site.path_www, 
             scheme=site.https_protocol
        ),
        method=self.rd.POST,
        data={
             'username': username,
             'password': password,
             'targetUrl': target_url
        }
   )

You can see here as well that we’re using a URL builder to generate our links: we’ve included the base class for this as well for your enjoyment.

Everything Else

There are several other constructs included in the Coyote Framework, including DB support (base classes for entities, etc), logging, config tools, and various utility functions. If you have specific questions on how these work, please either reference the examples (coming soon!), or leave us a comment on Github. We’ll be happy to explain.

Happy testing!

In case you missed it above, here’s a link to the repo on Github.

Acknowledgements

This little bundle of joy wouldn’t have been possible with out the hard work of current and former Shapeways employees, specifically Justin Iso, Hans Wang, and Zheng Qin. Thanks guys!
A Tale of Two Servers: A Short Story About ZFS on Linux

Originally posted on the Shapeways Tech blog

It was NOT the best of times.


Storage. Every tech venture needs it to some degree, so much so that there are entire businesses built around providing it. At Shapeways, we manage our own hardware in our own data centers, and therefore provide our own storage services and solutions. We host well over 100TB of content (and growing every day), comprised of user-provided 3d models, images, renders, and all the digital nuts and bolts required to bring our users’ digital creations to life in the real world.

ZFS on Linux - A Very Brief Introduction

Shapeways has iterated through several storage solutions as our needs have evolved, and are currently using ZFS on linux as the base of our system. ZoL is fast, redundant, supports replication, and offers compression which is extremely effective on the type of content we’re storing. I’m not going to go into all the specifics about our ZoL configuration (we’ll get that in a different post), but suffice to say that it’s been great for us….for the most part. This is the story of one of the struggles we’ve had (caused by our lack of understanding of ZoL’s inner operations), how we diagnosed and addressed the issue, and how we’ve protected ourselves from it occurring again. My hope here is that this will save someone a few sleepless nights somewhere down the road :smile:

Code Red

On a Monday afternoon much like any other, our normally performant website began to slow down. A lot. Pages with 200ms server response time shot up to seconds. Slower, more content-heavy pages, tens of seconds, causing our DNS and CDN provider to actually consider us offline. We began triaging immediately, but were having difficulty pinpointing the issue. Datadog was reporting increased load on all major systems, including webnode, database, model processing, and storage. IOPS on our primary storage server were up, ok. Context switching was high, but not through the roof. Actual CPU utilization, however…fine? There were a great many processes, but almost all were idle or waiting. So, everything is slow, and there’s no clear indication why. The blocking processes pointed at storage, but we didn’t see any signs in our monitoring that storage was the issue. We knew that ZoL would start to run into issues if we ever got more than 85% full on any of our ZFS tanks (related to how ZoL uses CPU to search for free space), but we weren’t even close. So, wtf?

Load on our web servers, spiking.
IOPS on our primary storage node, doubling.


Given that nothing else was leading anywhere (and that our website was still down-ack!!), we started picking and pulling at ZoL’s command line tools, trying to get it to tell us what was wrong. Spoiler alert: we found it. However, before I explain it here, a little background on how ZoL is configured and operates for us is important.

ZoL — A Slightly Less Brief Summary of Configuration

To paraphrase Wikipedia: ZFS is a filesystem and logical volume manager rolled into one. Redundancy and protection against data corruption are it’s mission statement. Basically, a ZFS filesystem is built on top of virtual storage pools called “zpools”. Zpools are themselves comprised of ‘vdevs’, or virtual devices, which are constructed of block devices (in our case, entire hard disks). It handles all RAIDing and redundancy itself, so you can do away with expensive RAID controllers and just focus on your disks.

Logical diagram of a ZoL vdev.

The way we’ve got it set up, we have vdevs comprised of 9 identical drives, 7 for storage, and 2 for parity. For simplicities sake, you can assume that each vdev, therefore, acts like its own RAID-6 device, having redundant pairs of parity disks. Pretty sweet. We stick as many of these as we need to into a zpool, on which we mount the ZFS file system. The zpools are configurable, meaning you can add new vdevs to it at any time and extend the capacity of your filesystem. ZFS does its best to fill up your vdevs at the same rate, so that they grow together, but isn’t always successful. And that is the crux of our problem.

Back to the Matter at Hand

We started our ZFS system with 2 vdevs. Over the 18 months or so between our adoption of ZFS, we had added additional vdevs to our storage servers (in the US and EU), and additional servers, to accommodate our growing storage needs. As we added more vdevs, we extended the zpool and the ZFS mount in real time, with no downtime, keeping Shapeways humming happily along. Sweet! But remember when I said that ZoL would do its level best to grow the usage of the vdevs at the same time? Turns out that starting with vdevs which were already over 70% full was too much for it to bear. What had happened to us (and which we were able to discover due to the very excellent zpool list command) was that our original two vdevs were over 99% full! This was despite the filesystem itself being less than 65% full.

Emotions were running high.

Why You Have More Than One of Everything

We realized that this box was screwed. We could spend a week recopying and balancing ZoL, but we couldn’t afford that downtime. Enter: our backup servers. We had been keeping all of our backup servers up to date with the latest and greatest from our primary storage, and we had added the most recent one with all of its vdevs at once. This meant that we had a perfectly balanced copy of our entire storage on a second server, which we simply had to drop into place where the primary one resided. 30 minutes later, we were back online, hosting off of the backup server. We immediately initiated a block copy to the former primary server using ZFS send (which is a really really really cool little command) to perform a block-level copy of our entire file system from one machine to another, and got it replicating as the new backup server in that datacenter. Huzzah!

Fool Me Once, Shame on You…

We all learned quite a bit from this little exercise. The most painful lesson of all (for me, at least) was that we didn’t have the correct monitoring in place to detect this issue sooner. I have professed my adoration for Datadog more than once in the digital ink of this blog, so I wrote a Datadog check to track the usage statistics of your individual vdevs (there’s a lot of ‘em). We use this script on all of our hosts using ZoL today, and you’re welcome to check them out here. Unfortunately, ZoL requires root access (for now), so Datadog can’t accept my pull request to merge this into their default library as it’s against their policies to have their scripts running as root (fair enough!). However, you should feel free to use it if you think it’s helpful, and let me know if there’s anything I can do to make it more useful (or submit a PR if you’re hip like that).

In Conclusion

ZFS on Linux is, overall, wonderful. It works as advertised, and can save you a ton of cash on hosting your own storage through compression. It’s also got a really nice ecosystem around it to enable monitoring, reporting, and high availability should you require it. This was a small blemish on our overwhelmingly positive experience, but I wanted to be sure that we documented it to help others in the future.

Push All the Code: Deployment Tools at Shapeways

Originally posted on the Shapeways Tech blog

From “Machine Civilization” by World Order


Releasing software developed as a team can be hard. Complex interactions, changes to databases, multiple developers changing the same file…all of these behaviors are both required for developing software, and possible sources of bugs, regressions, performance degradation, and other software maladies. This has lead to teams fearing releasing, which leads to teams releasing less frequently (I’m scared of that: why would I do it often?), which leads to more changes per release, which leads to more complexity, which leads to bugs, which leads to…you guessed it, fearing the release.

It doesn’t have to be this way. Breaking the cycle is possible. With the right tools, test coverage, and development best practices, you can migrate from fearing your weekly/monthly/quarterly release to releasing code when it’s ready, multiple times per day. We’ve done it at Shapeways, and we’re certainly not the first, and definitely not the last (hopefully, you’re next!) Here’s how we did it.

Enabling Release when Ready

There are three behaviors which have enabled us to move to releasing multiple times per day:

  1. Investing in Internal Tooling
  2. Following Development Best Practices
  3. Writing and Running Tests

The remainder of this post will focus on our internal tooling. Our development best practices and writing/running tests behaviors will be covered in later posts. Onward!

Using Jenkins to Achieve CI

We realized right away that we needed to follow Continuous Integration best practices. We set up a Jenkins server in the office, and began using it for building and testing our deliverables every time we wanted to deploy to a testing environment. This did two things: it ensured that our unit tests were being run on every meaningful push, and it removed the need for developers to have intimate knowledge of the deployment process. Just click a button, and it’s there.

Ensuring that unit tests are run on all builds is one of the fundamental principles of CI: by doing so, you both protect yourself against regressions and remove the need for each and every developer to remember to run the tests themselves. Which, as anyone who’s ever written software as part of a team before knows, is a Good Thing. One less thing for developers to think about == one more step which will not be missed when the pressure is on. Plus, when done right, it can create a culture of quality, where developers enjoy writing tests because they see the benefit in their daily lives.

However, let’s not understate the importance of giving developers a button to deploy software. The benefit is twofold: all developers now have the knowledge and power to deploy (feels good, man), and your tools/ops/quality team can now change the deployment process without breaking everyones knowledge of how it works! You’ve provided your dev team with an interface that they can use to deploy, no matter what or how the deployment process has changed under the hood. Awesome. Because you’re gonna need to change your deployment process at some point as you scale.

So, that’s pretty cool, right? Developers can now simply click a button to deploy any branch of code to any environment you’ve got, be it dev, qa, or even production. Definitely cool. Nothing could be cooler…except, why do I have to go to some random webpage to press a button? Can’t you make it easier than that?

Enter Slack+Hubot

For those of you who don’t know, Slack is a chat client. It’s way more than that, but for now, let’s just focus on the chat client aspect, and accept that we use it at Shapeways for communications across the company. One of the coolest features of Slack is its API: you can build integrations between whatever tools you’ve got (so long as they have APIs, and if they don’t, why are you using them?) and Slack. You can probably see where this is going.

But before we get there, let’s talk a little bit about the concept of ChatOps. A term coined by the good folks over at GitHub, ChatOps, by definiton is:

An approach to communication that allows teams to collaborate and manage many aspects of their infrastructure, code, and data from the comfort and safety of a chat room. - https://victorops.com/blog/chatops-for-dummies

GitHub is by no means the first company to play with this concept, but we’re gonna focus on them for the moment because they’re the originator of the next Really Cool Thing we’re gonna talk about: Hubot.

Hubot is, at its core, a chat bot. It can do clever things, like tell you when the 6 train is running behind (hint: all the f$&%ing time), and convert liters to gallons. However, its real value is that it can integrate with many tools and facilitate communication between them. This is where things get even better for your deployment pipeline.

Take the above example: you’re deploying using Jenkins. Super. Hubot ships right out of the box w/ a Jenkins integration: just plug in your credentials, and Hubot can now directly execute Jenkins jobs. Check it out, and note that names and urls have been smudged to protect the innocent :wink:

A Developer Deploys to Beta

So, there you have it. By simply creating the right Jenkins jobs and adding hubot to your chat app, you can manage all of your deployment requirements directly from your company chat application. Developers can now deploy to development, staging, and even production with a quick message. That’s even easier than clicking a button.

But wait, there’s more

While the built-in integrations are nice (and contain most of the base functionality that you need to get your ChatOps platform going), you’re probably going to find something that you want which Hubot simply can’t do. No worries: Hubot ships with its own scripting platform, enabling you to add your own functionality. At Shapeways, we’ve used this for both good and entertainment.

A few examples:

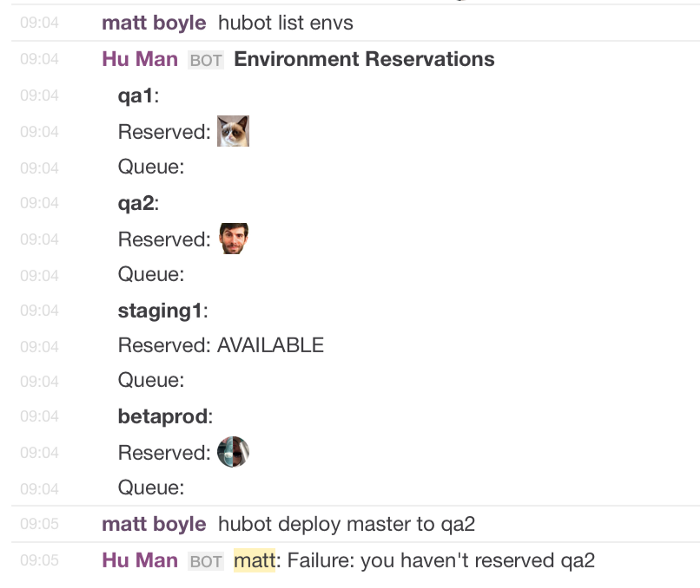
Reserving environments for deployment (with faces!), and preventing you from deploying an environment you don’t own. This saves us from asking the “wait, who’s got QA1 again?” question.

Looking for a shared environment

Queueing System for environments. This way, you don’t have to call dibs. Just get in line, and Hubot will automatically reserve the environment for you once it becomes available.

Reserving a shared environment

Executing our suite of automated functional tests against any of our environments using Selenium Grid. Custom reporting provided by our internally developed framework, Coyote.

Running functional tests against a QA environment

Permission management using HubotAuth: we don’t want just ANYONE to be able to deploy our site.

You'd better be on this list if you want to push code

Pretty cool, right? We’re looking to build in even further integrations into Hubot, and will contribute back those which don’t have specific Shapeways IP into the OSS community.

That’s a brief overview of some of the internal tooling that we’ve employed here at Shapeways to get us to Release when Ready. Stay tuned for coming posts on how we changed our development and testing practices to get us releasing multiple times per day.

The Express Lane - Improving Marketplace Speed

Originally posted on the Shapeways Tech blog

A few months ago, we released a new feature called “Dynamic Browse”, which enabled the dynamic creation and filtering of Marketplace pages on Shapeways.com. This enabled shoppers to more easily find products that would be of interest, as well as enabled our internal marketing and merchandising teams to create targeted shopper experiences on the fly. People started engaging with it: see for yourself.

People were digging it


However, there was a problem: it was kinda slow. We did see an improvement in user engagement. But that alone doesn’t mean that we were done. Here’s a great infographic from the KISSMetrics blog which illustrates this point: every second that your users spend waiting for a page to load is a second that they think about leaving. I won’t call out all the metrics listed in this chart (but you should really check ‘em out), but the conclusion here is that speed matters.

Our next steps were obvious: let’s make it faster! Great! Awesome! Excitement! ….how do we do that? The first step for us was to get some really granular measurements in place: we had a general idea of the performance of our pages, but not the specific data points required to understand the slowness. We use Datadog as a part of our monitoring and alerting system, not just because it’s easy to use (it is) and creates beautiful graphs and dashboards (it does), but because it’s very simple to set up your own custom metrics and track them to see what’s going on. So, to that end, we put together a very simple script that measured response time on one of our marketplace pages. We reported the total time from when the request is made until the first byte of the response is received (time-to-first-byte). When I say simple, I mean, REAL simple:

  #!/bin/python
  __author__ = 'matt'
  import requests
  from datadog import initialize, api
  options = {
      'api_key': OUR_API_KEY,
      'app_key': OUR_APP_KEY
  }
  initialize(**options)
  shapeways_marketplace_url = 'https://www.shapeways.com/marketplace/jewelry?li=home'
  r = requests.get(shapeways_marketplace_url)
  response_time_ms = r.elapsed.microseconds / 1000
  api.Metric.send(
      metric='perftesting.competition.response_time',
      points=(current_posix_time, response_time_ms),
      host=REPORTING_HOST,
      tags=['page:marketplace']
  )

This script runs once a minute in a new session (no preserved cookies or cache), and simply tells us how long it took to receive the first byte. Initial results, to the surprise of no one, were not great:

600ms is SLOW, yo.


It was taking around 600ms on average just to load the first byte! Things were slow on the server side.

We had an inkling that our search platform (which powers much of this feature) was not up to the task, and if that was the case the slowness on this portion of the request would be just the beginning: that same platform is used throughout the request to load different aspects of the page. We looked at the code and while there were definitely improvements to be made in the name of performance, we didn’t see anything that would create the kind of slowness we had measured. This left one other obvious place to check: infrastructure.

We use Solr to drive our search platform (which, as you have probably realized, is used for more than just searching for products). We have a single Solr master (which handles insertions and updates), and a pool of Solr slaves (which handle serving our web nodes for queries against Solr). This new dynamic marketplace was easily the heaviest usage of our Solr platform to date, so we were curious to see what sort of impact this was having on our servers.

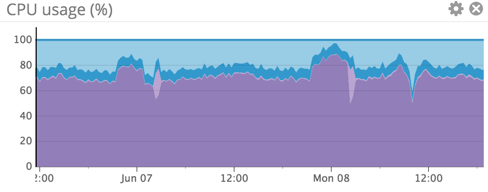
CPU...high
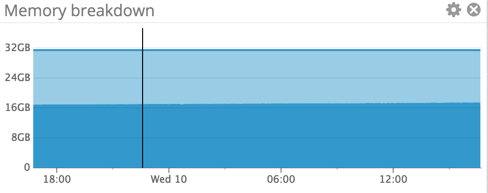
Are we using a lot of RAM? Yes, yes we are.
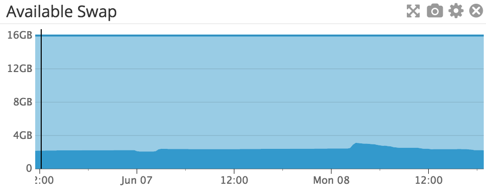
Constantly swapping to disk...ouch


We were using all available RAM on the systems, swapping to disk, and utilizing almost all available CPU. Yikes! Our CPU is way high, and there’s enough memory pressure that we’re forcing swaps to disk. We had been collecting average response time metrics for requests to Solr on these nodes (our app nodes: old hardware, past its prime):

100ms+ in solr alone...this is not the way


Crap. Over 100ms of response time on average for every Solr request. No wonder things were slow! This made it clear that it was time to upgrade.

We spec’ed out some modern boxes which met our needs from a CPU/Memory perspective, and got them spun up and added them into the pool. What a difference! Here’s their server-side metrics:

CPU way down.
Memory pressure, removed.
Swap-free zone


Our CPU usage is around 25%, memory usage is holding steady, and there’s no swapping to be found. This lead to direct improvements in Solr response time, as you can see in the graph below

Solr response times, WAY improved

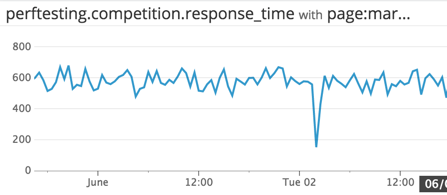
We cut our average Solr response time to around 20% of what it was originally. So, the fair question at this point is “What impact did this have on the site response time?” The answer: we cut our time-to-first-byte response time on Marketplace pages by half.

Double performance!

In addition to the evidence here, the proof was in the usage of the marketplace: it felt fast. This lead to increased engagement on these pages, as well as improved conversion rates. Awesome!

This performance gain helped our response time on other pages as well. We noticed improvements in response times across the board, including our Homepage, Product Pages, and Inshape, our ERP system for managing our orders in process.

We’re excited about the performance gains we’ve made with this change, and are making plans for future improvements across our technology stack.